Adding a new monitor
When you haven't created a monitor yet or when you want to add a new one you go to the Monitors page and click on 'Add new monitor'. This will open en popup screen in which you can choose what kind of monitor you want to add: a counting monitor or a smiley monitor. Choose one of them and give your monitor a name. Then click on 'Add'.
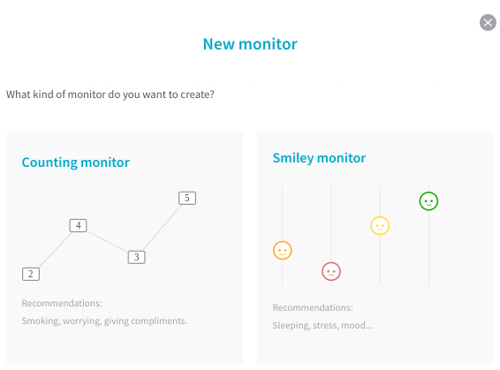
Smileys
Monitors with smileys are useful for tracking your mood, your stress levels during a day, if you slept well or not and your general wellbeing. You can decide what a happy smiley will mean in the chart: a high record, when you slept really well for example, or a low record, for example when your stress levels were really low that day.
Counting
Counting monitors are useful for keeping track of how often you do something on a certain day. Smoking a cigarette for example, or drinking a glass of water.
Tracking something in an existing monitor
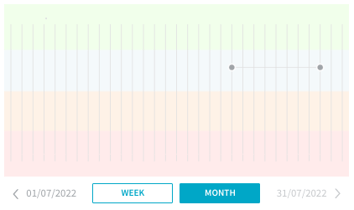
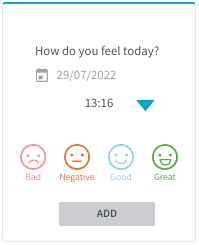
The names of the monitors you have created earlier will appear on the Monitors page as a row of buttons. To track something in a monitor you click on the button with the name of this monitor. A form will appear that you can use to add a record to your monitor. This form is set to the current date and time by default but you can change the date and time if yoiu want to add a record for a different moment. The records you track will be added to the graph on the right-hand side. Here you can view your record per week or per month. With the arrows you can skip a week or month ahead or back in the graph.
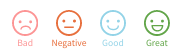
Smileys
In a monitor with smileys there are four different values: bad, negative, good and great. Select one of the smileys and click on 'Add' to add a record to the graph.
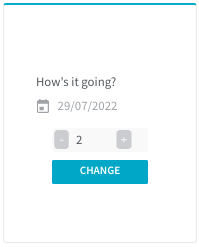
Counting
In a counting monitor you can add a value to the graph by using the plus and minus symbols. When you want to track how many glasses of water you have drunk during a day, for example, you can click on the plus sign first and on 'Change' subsequently. The number you have entered will then be added to the total in the graph.
Your professional can ask for access to your monitors. You will receive an invitation via mail if they do.
User Guides for Clients
Would you like more information about working with our platform? Check out our other user guides here: User Guides for Clients
Can't find the answer to your question?
Click on the blue Support button to contact us or send us an email via info@therapieland.nl of info@gezondeboel.nl
You can also reach us by phone, from Monday to Friday between 9.00 and 17.00h via 020-7712848 for Therapieland or via 020-8545108 for Gezondeboel.